2008 to 2020 Analysis of Voter Turnout
October 2020
Each election cycle brings a new wave of interest in voter turnout. More specifically, interested parties want to know which voters will go out to the polls to choose their preferred candidate. Political parties, candidates, and special interest groups focus their efforts on where they will get the most “bang for their buck.” This strategy may win elections, but it does not address the growing concern with who is left out of the electoral process.
This research project, funded by a generous grant from the California Community Foundation, moves away from an emphasis on the candidates and toward an emphasis on the areas where residents are choosing to vote, or more concerning, not to vote in Los Angeles County.
Analogous to food deserts, where people lack healthy food options, we use the term “civic deserts” to describe these areas of low voter participation (i.e., low voter turnout - where individuals who are already registered to vote choose not to vote). This research also digs into areas of low vote by mail (VBM) turnout, which will likely become especially important as we look ahead to the November election where all of LA County's registered voters will receive a VBM ballot.
Our goal is to generate awareness by describing and explaining the characteristics of these civic deserts – with the hope of decreasing the persistence of these civic deserts in coming elections.
About the Data
Voter turnout is defined as the percentage of ballots cast out of the number of registered voters. We analyze turnout in three steps: (1) visualizing voter turnout for the 2020 Presidential Primary; (2) analyzing significant clusters of voter turnout for the 10 major elections from 2008 to 2020 through space and time; and (3) analyzing significant clusters of VBM turnout for the 2020 Presidential Primary.
When we refer to "significance" throughout the report, we are talking about statistical significance. Statistical significance means that results are not likely due to random chance alone, so the patterns we see are meaningful in the sense that they should have underlying factors (versus be simply due to spatial randomness).
Want to know more about the methods for each map? Click here.
We encourage you to click on the maps below and explore the data in more detail!
2020 Presidential Primary Election Turnout
Visualizing turnout percentages shows precincts where turnout was above or below overall turnout for the county.
The 2020 Presidential Primary was the first time Angelenos were able to cast their ballots at any vote center across LA County, instead of their traditional assigned neighborhood polling places. The voter turnout for Los Angeles County was 38.3%, three percent lower than in the 2016 Presidential Primary.
When mapping turnout by precinct, notable patterns emerge: the lowest turnout appears in the middle of the county, spanning from Downtown to North Long Beach, stretching as east as Bell Gardens while reaching as west as Westmont. Conversely, high turnout can be seen along the coast, through the San Fernando Valley, and across the middle of the county.

2008-2020 Turnout Space-Time Analysis
Analysis by space and time shows how clusters of low and high turnout have changed over the last 10 major elections.
The patterns on Map 2 show us areas of significant low and high turnout as well as their changing patterns over the 10 elections. Many of these significant turnout patterns also appeared in the 2020 data (see Map 1), indicating that the vote center model did not substantially change voter behavior in areas with entrenched voter absenteeism.
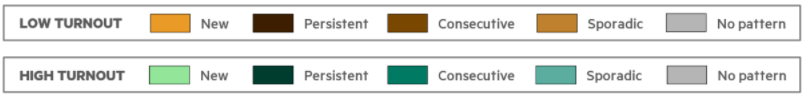
Significant low and high turnout areas change over time, and these patterns of change are classified as new, persistent, consecutive, or sporadic.
Civic Deserts
We see four types of significant low turnout areas across the ten elections. All four (new, persistent, consecutive, and sporadic) comprise the "civic deserts," our areas of concern.

Significant low turnout patterns are presented on this map. We label these areas, where low voter turnout is established and widespread, as "civic deserts." Note, the boundaries of the civic deserts are not necessarily the same as the geographical areas for which they are labeled.
Civic deserts are clusters of at least 10 adjacent precincts with significant low turnout, analyzed spatially and over time. There are several types of precincts with significant low turnout:
New spots are low turnout precincts that have become significant in the most recent election but were not significant before.
Persistent spots are precincts that have been significant in nine of the ten elections.
Consecutive spots are precincts that have been significant for several recent elections in a row, but were not significant in the most recent election.
Sporadic spots are precincts that were significant low turnout spots in some elections.
There are a total of nine distinct civic deserts in Los Angeles County and the following maps explore each of the nine deserts in more detail.
San Fernando Valley Civic Desert
Significant low turnout in some elections and an area of growing concern (new low turnout spots emerged in March 2020).
This civic desert is a mix of sporadic, consecutive, and new areas of low voter turnout occupying the northeastern portion of the San Fernando Valley. In particular, these new areas of low voter turnout suggest that the desert may be expanding into northern Van Nuys and northeastern Panorama City.
San Gabriel Valley Civic Desert
Significant low turnout in some elections with no current signs of expansion.
The civic desert is made up of entirely sporadic spots, which means that this area has seen significant low turnout for some of the elections. The lack of new spots is good news - it suggests there is no current expansion of this desert.
El Monte Civic Desert
Significant low turnout in some elections and some indication of expansion in the southeast area.
The El Monte civic desert is almost entirely sporadic spots, with one single new spot in the southeast. While only one new spot is present, monitoring this cluster will be important to see whether there is larger expansion of this desert in future elections.
Pomona Civic Desert
Significant low turnout in some of the elections and no signs of further expansion.
This civic desert is sporadic in nature, with significant low turnout on some elections. There are no new low turnout areas, which indicates this desert is currently static and is not expanding.
Eastside Civic Desert
Significant low turnout in some elections and signs of expansion in the southeastern direction.
The Eastside civic desert is comprised mostly of consecutive low turnout areas, with some sporadic areas in the northern half and several new areas in the southeastern edge of the desert. The southeast portion is a growing location of concern for voter turnout in future elections.
South LA Civic Desert
The middle section has seen historically significant low turnout, while the rest has had low turnout in only some elections. This desert may be slowly expanding.
The South LA civic desert is the largest desert by geographical area and number of precincts, and all four types of low turnout spots are present. The very middle of this area has seen historically significant low turnout (90% of elections), while the rest of the area has seen low turnout on some of the elections. Additionally, a few new low turnout spots are scattered throughout the desert. Their presence is an additional concern, suggesting that this entrenched area of low voter turnout could be expanding instead of shrinking.
Inglewood-Lennox Civic Desert
Significant low turnout in some of the elections and no signs of further expansion.
The Inglewood-Lennox civic desert is made up almost entirely of sporadic spots, which means this area has seen significant low turnout on some of the elections. As a cluster of mostly sporadic spots, this area may appear of less concern than other deserts. However, this pattern also means that timely interventions in this area can be particularly useful as the spots have not solidified yet.
Wilmington-Carson Civic Desert
Significant low turnout in some of the elections and signs of some increase in size.
This civic desert is a mix of persistent, sporadic, and new low turnout areas. Most of the persistent areas are in the southern half of the desert, while the new low turnout areas are concentrated in the north.
Long Beach Civic Desert
About half of precincts had significant low turnout in 90% of elections, making it a well-established area of concern.
This civic desert is made up of a core of persistent low turnout areas, with sporadic spots to the east and west. There are no new low turnout areas, which means this desert is not currently increasing in size.
Demographics of Civic Deserts
Understanding the population characteristics of civic deserts uncovers underlying factors which may be common among areas with low voter turnout.
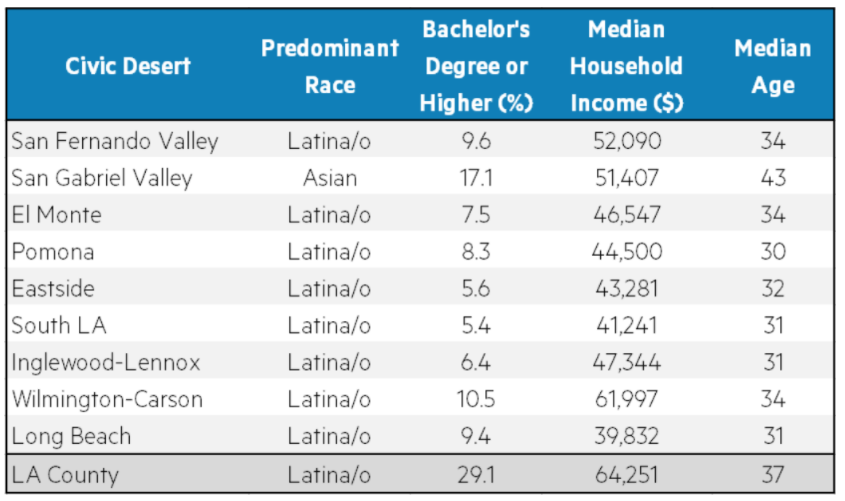
Latinas/os are over-represented in civic deserts: over 70% of the population in areas identified as civic deserts identify as Latina/o, relative to 48% for LA County overall. The only civic desert which isn't majority Latina/o is San Gabriel Valley, which is majority Asian. Most civic deserts share similar demographics, with less educational attainment, a lower median household income, and a younger median age than LA County overall.
The demographic map shows the predominant race in each precinct, with darker shading representing a higher percentage of the predominant race in the racial breakdown of each precinct.

2020 Vote by Mail Turnout
With every registered voter receiving a vote by mail (VBM) ballot for the November 2020 election, the percentage of ballots cast through VBM is of particular interest this fall. Specifically, we want to see which civic deserts are likely to experience an additional burden of significant low VBM turnout in the 2020 Presidential General. Due to the many recent initiatives aimed at promoting VBM, we focus our analysis on the latest data available - the 2020 Presidential Primary.
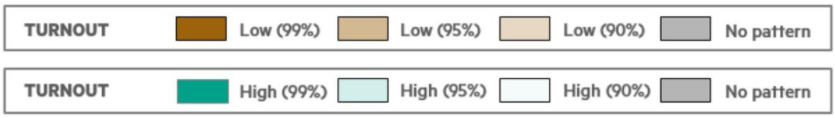
This map shows significant clusters of high and low VBM turnout for the 2020 Presidential Primary. The darker the shade, the more confidence we have that the turnout patterns we see are significant and thus meaningful. Dark grey areas indicate no significant patterns in turnout, while light grey areas were not analyzed due to low registration (<100/precinct). Black outlines show boundaries of the nine civic deserts discussed in the previous section.
We encourage you to click on the map below and explore significant VBM turnout clusters in more detail!
2020 Vote By Mail Turnout
Low VBM turnout is of considerable concern for Eastside and South LA civic deserts.
We now look at VBM turnout in and around the civic deserts. Seven out of the nine deserts are likely to experience the double burden of low overall turnout as well as low VBM turnout in the 2020 Presidential General Election.
San Fernando Valley Civic Desert: Most of this desert did not have low VBM turnout in March 2020. There is, however, a cluster of significant low VBM turnout in the northern section of the desert - a cluster that extends beyond the desert's boundaries.
San Gabriel Valley Civic Desert: Low VBM turnout is not likely to be a concern for the 2020 General for this desert - there are no significant low VBM turnout clusters in this area.
El Monte Civic Desert: The southeastern portion had significant low VBM turnout in March 2020. An even larger cluster of low VBM turnout is located to the east of this desert.
Pomona Civic Desert: The eastern area of this desert had significant low VBM turnout in the 2020 Primary.
Eastside Civic Desert: Low VBM turnout is a visible throughout the entire Eastside desert. Moreover, significant low VBM turnout extends up north and south outside of its boundaries.
South LA Civic Desert: Most of this desert (except the northern and southern parts) had significant low VBM turnout in the 2020 Primary. Additionally, significant low VBM turnout extends beyond the desert's boundaries in the northwest.
Inglewood-Lennox Civic Desert: The northern and middle portions of this desert had significant low VBM turnout in the 2020 Primary. Note that this is only a portion of a larger low VBM cluster next door - the one that occupies the majority of the South LA civic desert.
Wilmington- Carson Civic Desert: The southern half of the Wilmington desert had significant low VBM in the 2020 Primary.
Long Beach Civic Desert: Low VBM is unlikely to be an issue for this desert. In fact, this is the only desert that had areas of significant high VBM turnout in the 2020 Primary.
Key Takeaways
- Despite efforts to make voting easier, many registered voters are still not casting a ballot at the polls or by mail.
- Los Angeles suffers from nine areas of notable civic deserts in regards to voting.
- Two of these deserts are persistent from election to election (South LA and Long Beach).
- Five deserts are currently expanding rather than shrinking in size (San Fernando Valley, El Monte, Eastside, South LA, and Wilmington-Carson).
- Three deserts appear in some elections but not in most of them (San Gabriel Valley, Pomona, and Inglewood-Lennox).
- Latinas/os are over-represented in civic deserts: over 70% of the population in areas identified as civic deserts identify as Latina/o, relative to 48% for LA County overall.
- Compared to LA County overall, the civic deserts often have less educational attainment, a lower median household income, and a younger median age.
- Vote by mail (VBM) turnout will be especially salient during the November 2020 Presidential General election. In most civic deserts (7 out of 9), low VBM can be an additional concern (only San Gabriel Valley and Long Beach did not have low VBM turnout in the 2020 Presidential Primary).
- Political leadership in LA County has made voting easier than ever before. We call on all Angelenos to get out and vote and encourage others to do the same!
Sources
Data on voter turnout were gathered from the LA County Registrar-Recorder/County Clerk's Office.
Data on election precincts were gathered from the Statewide Database, the Redistricting Database for the State of California.
Data on demographics were gathered from 2014-2018 American Community Survey from the Census Bureau
Recommended Citations
Gilbert, Brianne; Vizireanu, Mariya; & Dunsker, Max (2020). LA County Civic Deserts: 2008 to 2020 Analysis of Voter Turnout. Thomas and Dorothy Leavey Center for the Study of Los Angeles, Loyola Marymount University, Los Angeles, California.
Contact Us
For more information about the results or methodology from this or other datasets from StudyLA, please contact Brianne Gilbert, Associate Director, at brianne.gilbert@lmu.edu.